
Investment Fees That Quietly Erode Your Returns
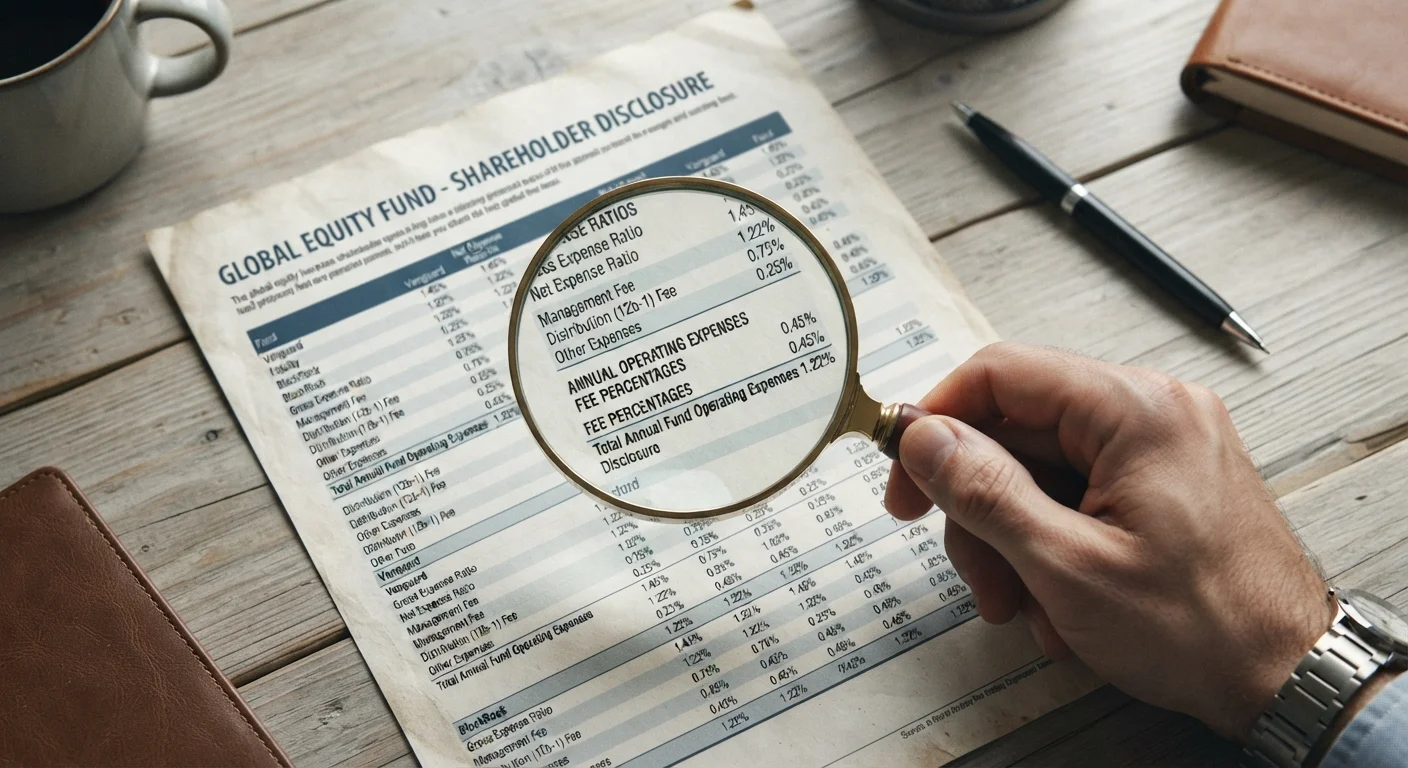
Photo credit: Wiseturt.com | Blogs Curated For You
In this article
Expense ratios, trading commissions, and advisory fees all chip away at growth. Learn what these charges are and how to read them clearly.
Key Takeaways
- Expense ratios, advisory fees, and trading commissions all reduce net investment returns over time.
- A 1% difference in annual fees can translate to tens of thousands of dollars lost over decades.
- Fund prospectuses and brokerage fee schedules disclose all charges - knowing where to look is half the battle.
- Low-cost index funds typically carry significantly lower expense ratios than actively managed counterparts.
- Tax-drag from frequent trading adds an invisible cost layer beyond visible fee line items.
Why Investment Fees Deserve More Attention Than They Get
Investment fees are easy to overlook. They don't arrive as a bill in the mail - they're deducted silently from returns, expressed in fractions of a percent, and rarely discussed in the same breath as portfolio performance. Yet their cumulative impact over a long investment horizon can be substantial.
The core mechanism is straightforward: fees reduce the amount of money that stays invested and continues to compound. Because compounding works on every dollar in your account, any dollar siphoned off by fees is a dollar that loses all of its future growth potential. If you want to understand why this matters so much, our overview of how compound interest works explains the dynamic clearly.
This article focuses on the most common fee-related mistakes investors make - not to alarm, but to make the math visible. General financial education like this is not a substitute for personalised advice; consider consulting a licensed financial adviser for decisions specific to your situation.
~1%
Typical annual fee charged by financial advisers
A common industry benchmark for adviser fees is roughly 1% of assets under management per year, according to widely cited financial planning industry surveys.
0.03%-1%+
Range of mutual fund expense ratios
Expense ratios vary widely - broad-market index funds often charge as little as 0.03%, while some actively managed funds charge over 1%, per publicly available fund prospectus data.
$30,000+
Potential 30-year fee drag on a $100K portfolio
Illustrative projections show a 1% annual fee difference on a $100,000 portfolio growing at 6% annually can reduce the ending balance by more than $30,000 over 30 years.
The Most Common Fee Mistakes - and How to Avoid Them
The errors below span beginners and experienced investors alike. They share a common thread: the costs involved are real but not immediately obvious, which means they persist far longer than they should.
Ignoring the expense ratio when selecting a fund.
Why it happens: Expense ratios are expressed as a small percentage - 0.5%, 1.0% - that feels negligible at first glance. Investors naturally focus on past returns rather than the cost quietly subtracted every year.
Underestimating the long-term drag of advisory fees.
Why it happens: A 1% annual advisory fee sounds modest, but it is charged on the entire account balance - including gains - every single year. Most investors don't mentally project this figure forward over decades.
Overlooking sales loads on mutual funds.
Why it happens: Front-end loads (charged at purchase) and back-end loads (charged at redemption) are not always prominently advertised. Investors may not realize a portion of their initial investment never actually gets invested.
Frequent trading without accounting for transaction costs and tax consequences.
Why it happens: The rise of commission-free trading platforms has created a perception that buying and selling is truly free. In reality, bid-ask spreads and capital gains taxes still apply.
Paying for account features or services you never use.
Why it happens: Brokerage and advisory platforms often bundle services - research tools, managed portfolios, personalized planning - into tiered fee structures. Investors may default to a higher tier without reviewing what they actually need.
For a broader look at how low-cost and actively managed funds compare on fees and historical performance, see our guide to index funds vs. actively managed funds.
Commission-Free Doesn't Mean Cost-Free
Many brokerage platforms now advertise zero-commission stock and ETF trades, which has genuinely reduced one category of investor cost. However, bid-ask spreads, fund expense ratios, and potential payment-for-order-flow arrangements still affect the true cost of trading. Read platform disclosures carefully rather than assuming 'free' means no cost at all.
Reading the Fee Disclosure Tables That Every Fund Must Provide
Under U.S. securities regulation, mutual funds and exchange-traded funds (ETFs) are required to publish a standardized fee table in their prospectus. This table lists the annual fund operating expenses - including the management fee, distribution fees (sometimes called 12b-1 fees), and other expenses - as a percentage of average net assets. The total of these line items is the fund's expense ratio.
Brokerage accounts have separate fee schedules covering account maintenance, wire transfers, and (where applicable) trading commissions. These are typically found in the platform's pricing or disclosures section, not inside a fund prospectus. Getting in the habit of reading both documents - the fund's fee table and your brokerage's fee schedule - gives you a complete picture of what you're actually paying.
Fee awareness is one part of a broader discipline of watching where money quietly disappears. Our article on household budget leaks covers the same principle applied to everyday spending.
The Fee Table Is a Legal Requirement - Use It
Every U.S. mutual fund and ETF must include a standardized fee table in its prospectus, as required by the Securities and Exchange Commission (SEC). This document is publicly available on the SEC's EDGAR database and on most fund company websites. Before investing in any fund, locate this table and verify the total annual fund operating expenses - it is the single most reliable source of fee information available to retail investors.
This article is for general informational and educational purposes only and does not constitute personalised financial, investment, or tax advice. Consult a qualified, licensed financial professional before making decisions about your own investments.

Author
Investment & Insurance Editorial Team
Investment & Insurance Editorial Team is the collective byline for our editorial team and contributor network. Articles published under this byline or an editorial pen name are researched, written, and reviewed according to our editorial standards for clarity, consistency, and independence before publication.
View all articles →